B2B Marketing Analytics: A guide to measuring your B2B marketing campaigns
Tracking where your customers come from, how many touchpoints they use, and how successful your marketing campaigns are is a huge job.
It’s also a necessary job that has a name: B2B marketing analytics.
B2B marketing analytics is a way for you to make decisions using data. It allows you to gather and analyze data through datasets, lenses, and dashboards to see what you are doing well and what you need to improve.
The good news is that instead of spending hours analysing spreadsheets and numbers: you can crunch this data in seconds, thanks to modern tech. As you see results in real-time, it gives you a chance to optimise marketing channels, tweak touchpoints, and fix holes in your strategy to boost your bottom line.
In this piece, we’re going to look at:
- What is B2B marketing analytics?
- The importance of a B2B marketing analytics dashboard
- How to set up B2B marketing analytics for your business
Let’s get started.
What is B2B marketing analytics?
B2B marketing analytics is a tool that allows you to track, monitor, and optimize your marketing strategy in real-time to boost your ROI. Thanks to customizable dashboards, B2B marketing analytics become a single source of truth to share insights with internal teams, view metrics, and make data-driven decisions.
It can be a complicated process, as there are many moving parts in a company’s marketing structure. There are also different stages someone goes through before they become a customer.
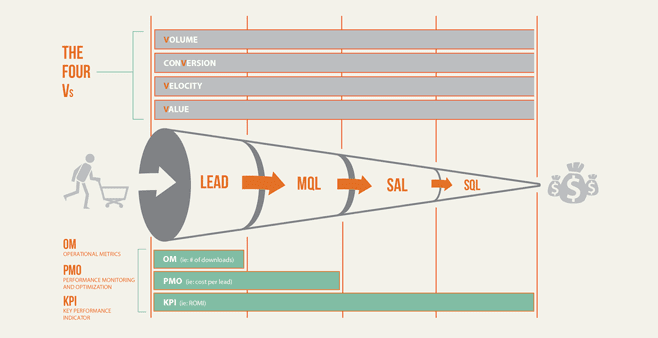
The job of analytics is to track every customer from the moment they become a lead until they convert. Only then will you see what parts of your marketing structure are working and if there are holes you need to plug. The easiest way to visualise what B2B marketing analytics does is to picture it as a funnel:
Before a lead enters the funnel, an analytics dashboard has already decided what metrics it’s going to track. Depending on how you customise your analytics setup, you can monitor everything from the time it takes a lead to become an MQL (marketing qualified lead) to the percentage of MQLs who turn into SQLs (sales qualified leads).
For example, if you wanted to track how engaged your email list is, you can set up a dashboard to track click-thru rates, opens, and unique clicks:
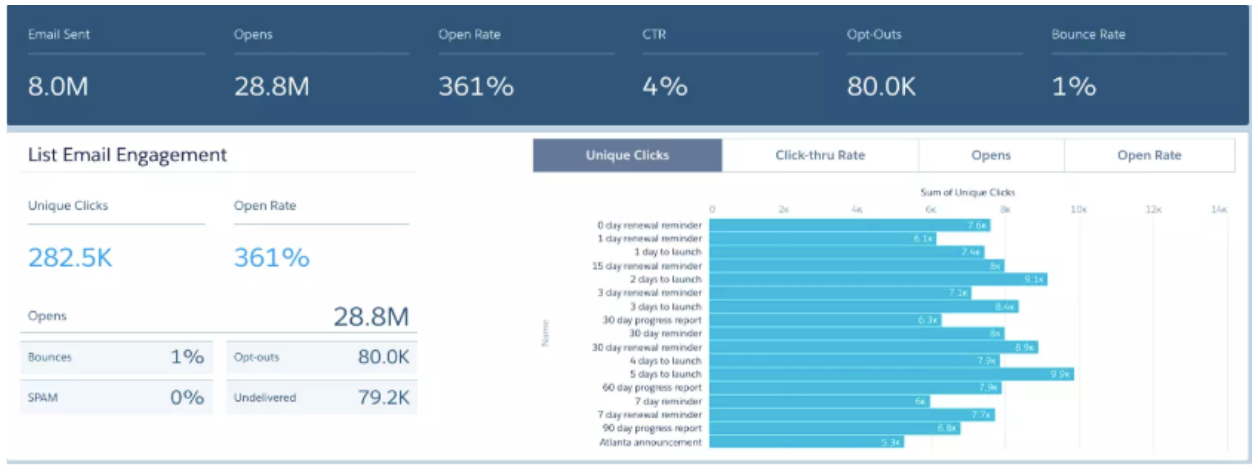
Once you gather enough data, you can see what email campaigns are resonating with your audience. If a campaign has low open rates or isn’t getting many unique clicks, it’s a sign that you need to change things up.
There are three key components to every B2B marketing analytics setup:
Datasets: Where source data is gathered and then used to build datasets you can then incorporate into dashboards
Lenses: How you will view and analyze each dataset
️ Dashboards: Curated charts that you view depending on your lenses. You can customize them based on metrics, charts, and almost any data point you wish
As you can see, each component is essential to any B2B marketing analytics structure. However, one of the most important structures is the dashboard—the tool used to view your analytics.
The importance of a B2B marketing analytics dashboard
Dashboards are hubs that store all of your data and show it in an easy-to-digest format.
Marketers can use B2B analytics dashboards to see how campaigns drive leads, what touchpoints are most effective, and even which accounts are bringing in the most revenue.
This data can help you decide what parts of your marketing strategy are worth investing more money in and highlight areas where you should be expanding. Say you have a bunch of high-revenue accounts that have certain things in common (company size, employee numbers, etc.). Your marketing team can take that information and use it to build new campaigns targeting prospects with similar personas.
Thanks to dashboards, analysing this information is easy. Using charts and breakdowns, you can view a snapshot of a dataset’s most important parts instantly. For example, a multi-touch dashboard can track what touchpoints are most influential during a customer’s buying journey, from first touch to last.
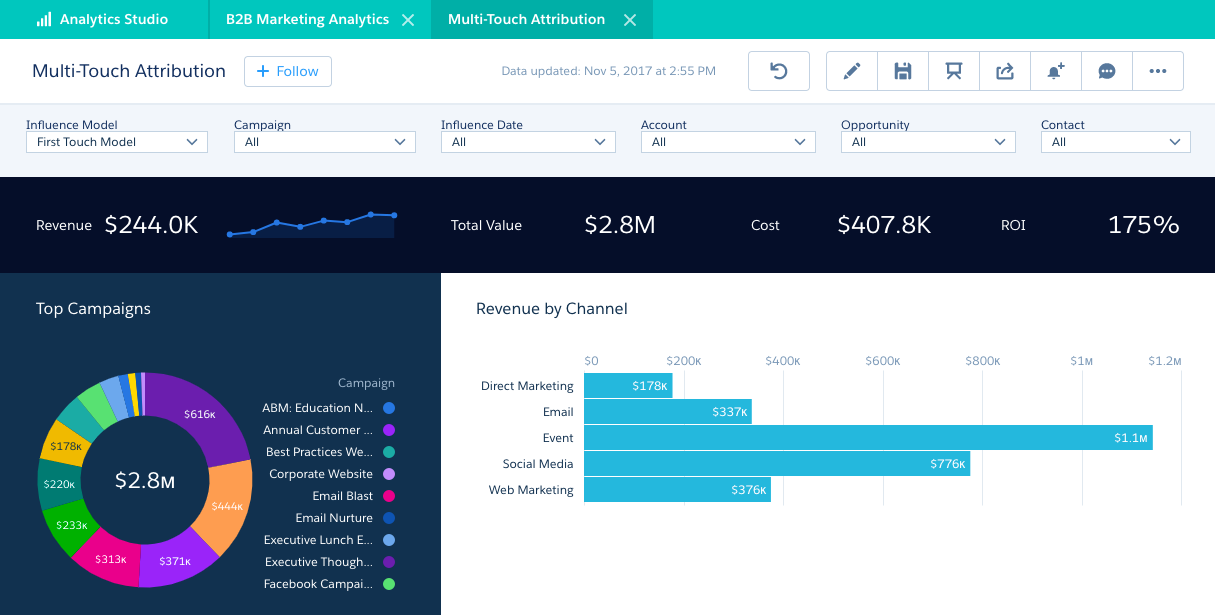
Salesforce’s multi-touch attribution dashboard
Then, the dashboard breaks each touchpoint down and allows you to view revenue, total value, cost, and ROI based on each channel. The dashboard can also give you predictive analyses and advise how to improve parts of your marketing strategy.
Now that you know what B2B marketing analytics is and how it works, let’s look at how to set it up.
How to set up B2B marketing analytics for your business
Before creating a B2B marketing analytics strategy, you need to think hard about what you want to track and what metrics are necessary to reach your business goals.
These metrics should all tie into your revenue model: how many prospects are converting, how many prospects enter your funnel, and how much value each customer adds to your bottom line. You can categorize these metrics into four areas:
- Volume: How many times your emails are opened and clicked, or the number of visits and impressions on your website and marketing assets
- Time: How long it takes leads to progress through your marketing funnel, the average amount of time a lead spends in each funnel stage, and how often prospects reply to campaigns like email sequences
- Conversions: The number of prospects that turn into leads, MQLs, and SQLs
- Value: What parts of your marketing strategy are impacting your ROI, such as how much it costs to get a prospect to the MQL stage, or what channel is bringing in the most leads
This all sounds like a lot. But thanks to the emergence of B2B marketing analytic tech, you can now create datasets and dashboards using pre-made templates. There are several tools you can use, like:
Data Studio
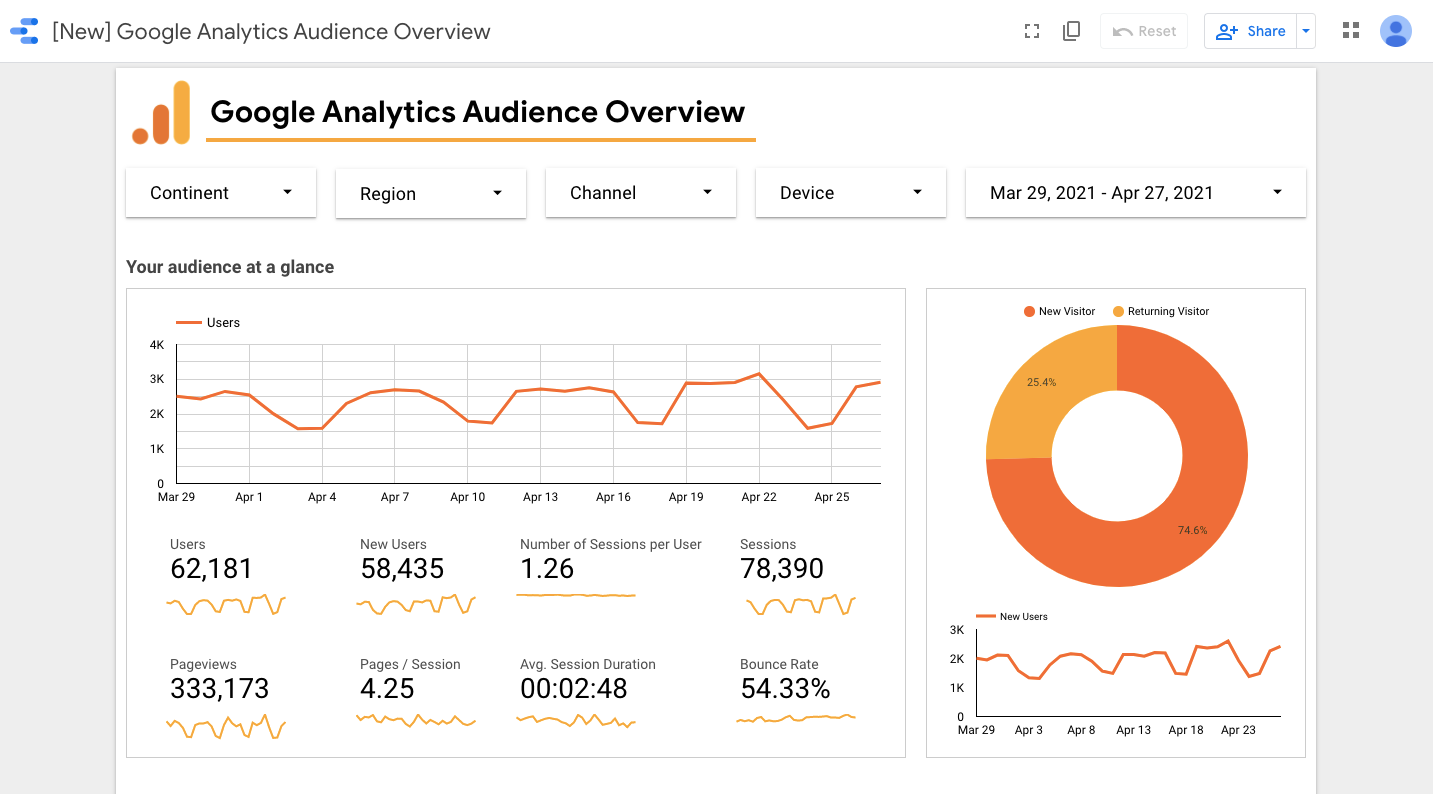
The original marketing analytics tool—Google’s Data Studio. With a library of pre-made templates, you can connect your Google account and then visualize and share data instantly. Find out more here.
HubSpot
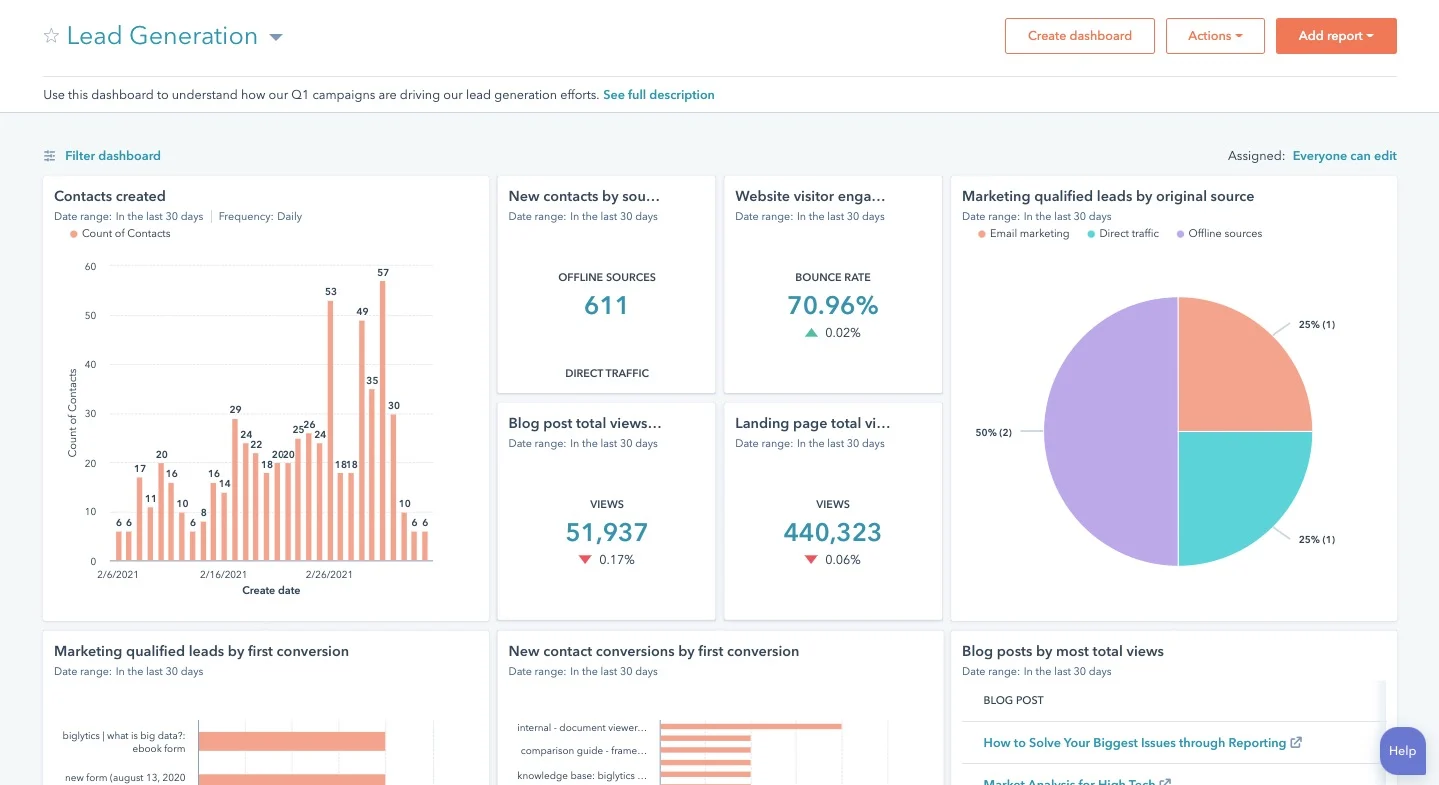
HubSpot’s B2B marketing analytics software is an all-in-one tool that allows teams to track entire campaigns from start to finish. Standout features include traffic analytics, lead generation reports, and triggered automation workflows. Find out more here.
Apteco
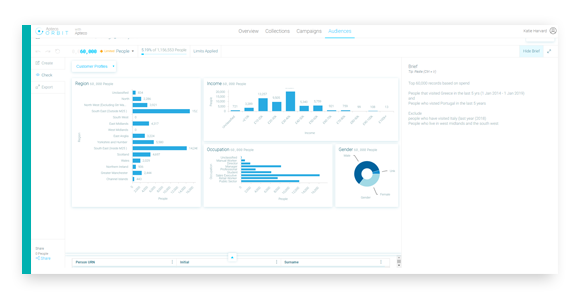
Apteco is a data-led customer analysis tool that gathers actionable insights that marketing teams can use to hone and deliver successful campaigns. Find out more here.
TapClicks
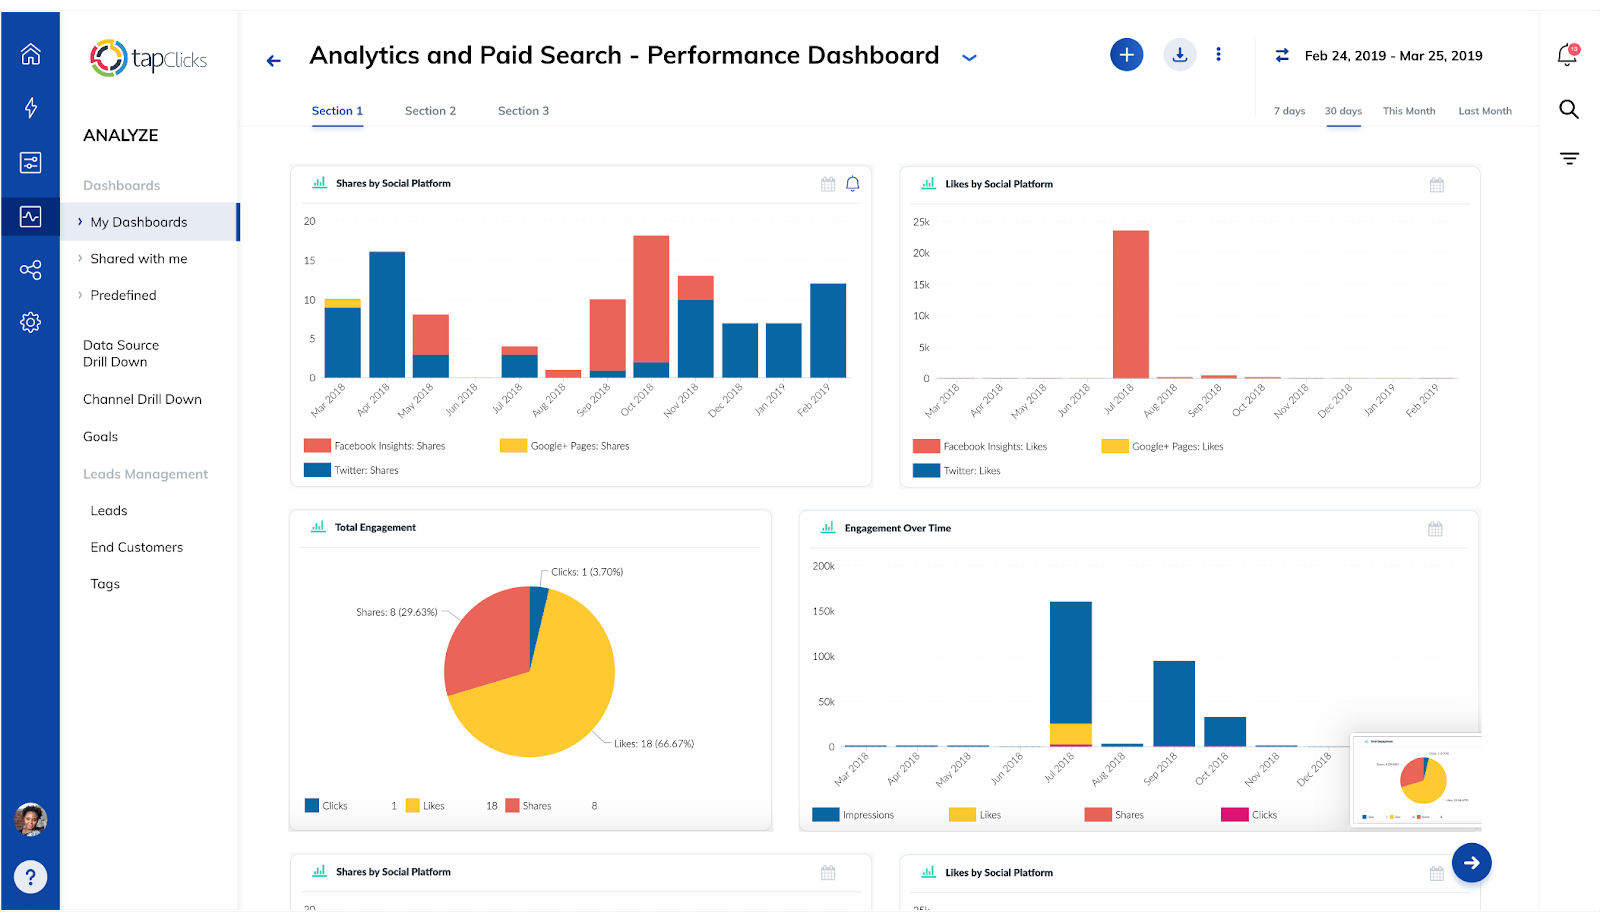
TapAnalytics has a range of tools that allow teams to group and segment data, track custom metrics, calculate spends, and set marketing goals. Find out more here.
One of the most widely used B2B marketing analytics tools is Salesforce Pardot, which offers companies datasets and dashboards they can use straight from the box. Here’s a quick look at how it works.
Datasets
You can import just about any type of data into Salesforce and turn it into a dataset—from forms to tags to opportunities.
Using pre-made templates, you can also create datasets for different types of marketing efforts, like:
- Campaigns: Vital information about individual marketing campaigns, like launch dates, budgets, targeting, and campaign ids
- Emails: Track key metrics like send dates, bounce rates, unique click rates, and open rates
- Templates: Monitor which email marketing templates work best with prospects and customers
- Forms: Keep track of which website forms are converting
- Landing pages: Monitor how many people visit a landing page and how well each page converts
Once you are ready to start collecting data using a dataset, you need to pick a dashboard to feed it into.
Dashboards
Out-of-the-box dashboards allow you to plug in datasets to monitor every stage of a marketing campaign.
You can monitor:
- Engagement: How engaged your prospects and leads are with your marketing materials and content, such as emails and landing pages
- Accounts: A detailed breakdown of what stages of the buying journey each one of your leads is in, as well as tracking other information like lifetime value
- Pipelines: Aggregate information about your pipelines, like how many leads, MQLs and SQLs your marketing and sales team is currently working with
- Touchpoints: What channels are bringing in the most revenue, and where your marketing and sales team are successfully converting customers on their buying journey
Let’s check out what one of these dashboards looks like from an overall marketing perspective.
This is one of the out-of-the-box Salesforce dashboards:
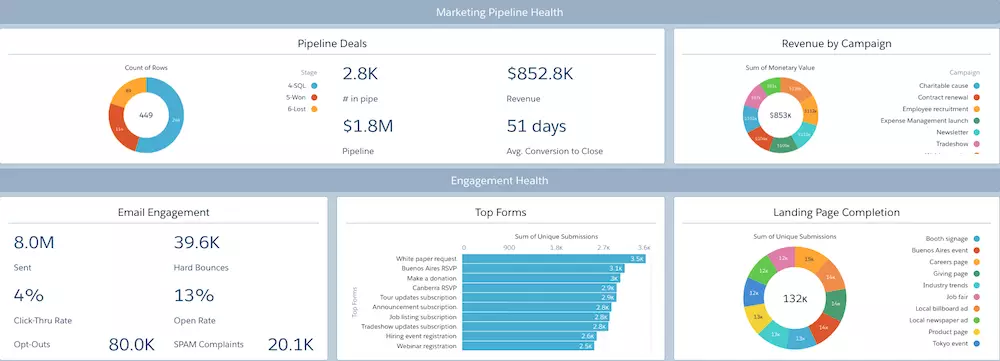
Salesforce’s Marketing Manager Dashboard
It provides an overview of your business’s health: how many deals are in your pipeline, landing page metrics, and campaign revenues. You can also see how each marketing effort is affecting sales and revenue.
Even from a quick glance, you can see what campaigns are bringing in the most revenue based on closed-won opportunities and how well leads are engaging with your emails. More specific pipeline, engagement, and conversion dashboards can also be from this one.
The best part about this dashboard? It’s straight out-of-the-box—all you have to do is plug in your data sets, and the tool will track every movement from every lead.
B2B marketing analytics lifts the hood on your marketing efforts
We all know the old marketing saying: if you can’t measure it, you can’t improve it.
There’s a reason every marketer knows it—it’s true. Your entire marketing strategy’s success depends on knowing where your customers are coming from, which marketing campaigns they are responding to, and what efforts generate the most revenue.
The good news is that with B2B marketing analytics, you can put all of this on autopilot. Thanks to datasets, lenses, and automated dashboards, marketers can now track which campaigns bring home the bacon in real-time.
What we’ve covered only scratches the surface of what is possible with B2B marketing analytics, but the real question is—are you ready to start using them?
If you want to know how you can better monitor and refine your b2b marketing campaigns then get in touch with the Clarity Performance team today.

